

Fleet fuel management is the practice of systematically tracking fuel purchases, consumption, and loss across every vehicle in your operation to reduce cost and expose inefficiency. Done right, it tells you exactly how many miles each truck squeezes from every gallon, which drivers are costing you money, and where fuel is walking out the door before it ever turns a wheel.
Fuel is not a fixed expense you absorb. It is a variable you control.
Who this is for: This article is written for fleet owners, dispatchers, and maintenance managers running diesel trucks in Southern California who need a practical system for tracking and reducing fuel costs.
Not for: owner-operators running a single truck who want general driving tips or carriers already running a fully integrated telematics and fuel card platform with dedicated fleet analysts.
Key Takeaways
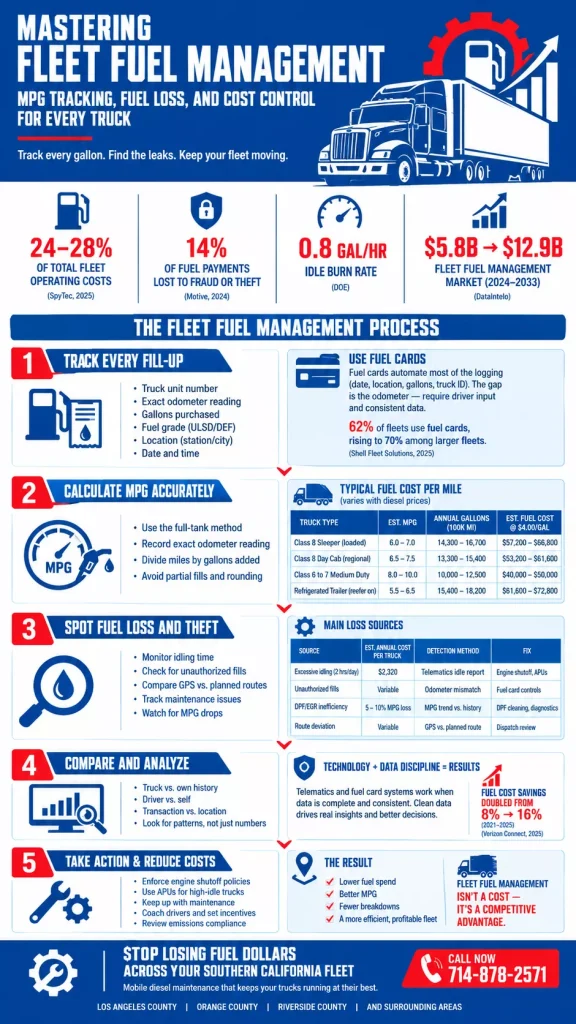
- Fuel represents 24 to 28% of total fleet operating costs, making it the single largest controllable variable expense (SpyTec, 2025).
- An estimated 14% of fleet fuel payments were lost to fraud or theft in 2024 (Motive Physical Economy Outlook, 2024). That number is not a rounding error.
- The full-tank fill-up method is the most reliable way to calculate truck MPG. Partial fills produce misleading numbers.
- Comparing a truck against its own history, not fleet averages, catches degradation before it becomes a breakdown.
- Idle burn costs more than most managers realize: the DOE estimates 0.8 gallons per hour, meaning a single truck left idling two hours daily burns through roughly 580 gallons per year.
- Technology without data discipline fails. A fuel card program or GPS system only works if fill-up records are complete and consistent.
What Fleet Fuel Management Actually Covers
Fleet fuel management is not just buying fuel cards and calling it a day. It is an operational data practice that ties every gallon purchased to a specific truck, a specific driver, a specific date, and a specific odometer reading. When all four data points connect cleanly, you can calculate real consumption, catch anomalies fast, and trend each truck over time.
The global Fleet Fuel Management System market reached USD $5.8 billion in 2024 and is projected to reach $12.9 billion by 2033 at a compound annual growth rate of 9.1% (DataIntelo, 2024). That growth is not driven by novelty. It is driven by fleets realizing that unmanaged fuel spend is a silent profit drain.
According to ATRI in 2026, fuel accounts for 20 to 30% of total carrier operating costs, rising to 28% in years of elevated diesel prices. For a ten-truck operation burning 15,000 gallons per truck per year, a 10% reduction in consumption is not a rounding error. It is a six-figure swing in net margin.
The articles published by Precision Diesel cover fleet operational topics that connect directly to fuel spend, including maintenance intervals and compliance issues that drive unnecessary consumption.
How Much Fuel Actually Costs Per Mile of Operation
The competitor analysis framing of fuel as roughly $0.48 per mile is a useful starting point, but that number moves fast with diesel prices. What matters more is the percentage of total operating cost fuel represents, because that ratio tells you where to focus reduction effort.
ATRI’s 2026 data puts fuel at 28% of carrier operating cost during high-price periods. Expert Market’s 2025 research lists cost of fuel as the top operational risk for 31% of U.S. fleet operators, ahead of vehicle breakdowns (14%) and maintenance cost (13%). Fleets that treat fuel as a pass-through expense are leaving real money on the table.
| Truck Type | Estimated MPG (Highway) | Annual Gallons (100,000 mi) | Estimated Annual Fuel Cost at $4.00/gal |
|---|---|---|---|
| Class 8 Sleeper (loaded) | 6.0 to 7.0 | 14,300 to 16,700 | $57,200 to $66,800 |
| Class 8 Day Cab (regional) | 6.5 to 7.5 | 13,300 to 15,400 | $53,200 to $61,600 |
| Class 6 to 7 Medium Duty | 8.0 to 10.0 | 10,000 to 12,500 | $40,000 to $50,000 |
| Refrigerated Trailer (reefer on) | 5.5 to 6.5 | 15,400 to 18,200 | $61,600 to $72,800 |
These are baseline estimates. A truck running consistent mountain grades in Riverside County will underperform these numbers consistently.
How to Calculate Truck MPG Accurately
The full-tank method is the standard. Fill the tank completely. Record the odometer. Drive. Fill it completely again. Divide miles driven by gallons added on the second fill. That is your MPG for that interval.
What trips up most managers is partial fills. A driver tops off mid-trip without logging it, and the next full-tank calculation looks artificially efficient. The math is wrong because the starting baseline was never accurate.
In practice, the pattern that keeps showing up in fleet operations is drivers who record odometer readings imprecisely. Rounding to the nearest hundred miles when the actual reading is 87,432 compounds over six months into consumption data that is useless for trend analysis. The fix is simple: require the exact odometer at every fill. No rounding.
For fleets running the importance of semi truck fleet maintenance as a priority, MPG tracking integrates naturally into the same service intervals where you are already collecting mileage data.
What to Log at Every Fill-Up
Every fill-up event should capture six fields, no exceptions:
- Truck unit number (not just the driver’s name; drivers change trucks)
- Exact odometer reading at time of fill
- Gallons purchased from the pump receipt
- Fuel grade (ultra-low sulfur diesel or DEF, if applicable)
- Location (fuel station name or city)
- Date and time of transaction
Missing even one field regularly breaks your ability to catch theft and leaks. A fill-up logged without an odometer reading is just a cost entry. It tells you nothing about efficiency.
62% of fleets currently use fuel cards, with adoption rates rising to 70% among larger fleets (Shell Fleet Solutions, 2025). Fuel cards automate most of this logging because the card transaction captures date, location, gallons, and truck ID automatically. The gap is the odometer, which still requires driver input. That is where data discipline matters most.
Where Fuel Disappears Before It Moves a Load
Fourteen fleets in the 2024 Fleet Fuel Study, operating 75,000 trucks, saved $512 million in 2023 compared to average trucks on the road (NACFE, 2024). That gap between their fuel spend and the average fleet’s is not entirely explained by aerodynamics. A meaningful share comes from disciplined loss prevention.
The main loss categories:
- Idling: The U.S. Department of Energy estimates diesel engines burn approximately 0.8 gallons per hour at idle. Two hours of daily idling per truck adds up to roughly 580 gallons per year per truck. On a 20-truck fleet, that is 11,600 gallons annually before a single load moves.
- Unauthorized fill-ups: A driver fuels a personal vehicle using a company card. Without odometer verification, this is nearly invisible.
- Route deviation: Detours add miles and burn fuel that never appears in the load’s cost calculation. GPS data against planned routes catches this.
- Deferred maintenance: A clogged DPF filter, worn injectors, or low tire pressure each degrade MPG quietly over time. An estimated 14% of fleet fuel payments were lost to fraud or theft in 2024 (Motive Physical Economy Outlook, 2024), but deferred maintenance losses compound on top of that.
Addressing emissions-related maintenance directly affects fuel burn, and reviewing california truck emissions compliance requirements for your fleet is not just a regulatory obligation but also a consumption optimization step.
| Loss Source | Estimated Annual Cost per Truck | Detection Method | Fix |
|---|---|---|---|
| Excessive idling (2 hrs/day) | $2,320 (at $4.00/gal) | Telematics idle time report | Engine shutoff policy, APU units |
| Unauthorized fills | Variable, up to 14% of fuel spend | Odometer mismatch alerts | Fuel card controls, PIN requirements |
| DPF/EGR inefficiency | 5 to 10% MPG loss | MPG trend vs. history | Scheduled DPF cleaning, diagnostics |
| Route deviation | Variable by run | GPS vs. planned route | Dispatch review, driver coaching |
How to Spot Fuel Theft and Consumption Anomalies
Fuel theft rarely announces itself. The signal is almost always a statistical outlier: a truck showing 15% worse MPG than its own six-month average, a fill-up that occurs 40 miles from the truck’s last GPS ping, or a transaction at midnight when the truck was not dispatched.
Three comparison methods that actually work in practice:
Unit against history: Compare each truck to its own MPG baseline across the last 90 days. A truck that ran 6.8 MPG for three months and suddenly drops to 5.9 MPG warrants a maintenance check before you blame the driver. What usually trips people up here is blaming behavior when a mechanical issue is the actual cause.
Driver against self: If a driver swaps trucks and their consumption number stays high, the problem follows the driver. If the number improves with the new truck, the old truck has a mechanical issue.
Transaction-location cross-check: This requires GPS. If a fuel card transaction occurs at a location 60 miles from the truck’s last recorded position, that transaction needs review immediately.
For broader maintenance patterns that protect against hidden consumption losses, diesel truck repair tips from Precision Diesel’s team address the mechanical side of efficiency degradation.
Fuel cost savings doubled from 8% to 16% between 2021 and 2025 for fleets using telematics-based fuel programs (Verizon Connect, 2025). That improvement did not come from buying newer trucks. It came from better visibility into where the fuel was going.
The Wikipedia overview of fleet management systems provides a useful framework for how fuel tracking integrates with broader fleet data systems if you are evaluating platform options.
Technology, ROI, and Where Platform Selection Falls Short
The Fleet Fuel Management Software market stands at $2.13 billion in 2024, growing at 11.6% annually (Growth Market Reports, 2024). There is no shortage of platform options. The trade-off is that most platforms require clean, consistent data input to return useful analytics. A telematics system layered on top of sloppy fill-up logging gives you dashboards full of noise.
The catch with most mid-market platforms is integration. A fleet running older trucks without OBD-II accessible ports, or running mixed manufacturers like Kenworth and International on the same yard, will face integration friction. Expect setup time measured in weeks, not hours.
Driver behavior is where most ROI projections fall apart. A platform can flag idling events, but if there is no coaching conversation or incentive structure attached to that flag, idling rates do not change. 77% of respondents in Verizon’s 2025 Fleet Technology report named increasing costs as their top challenge. Technology is the tool. Driver engagement is the mechanism.
Regulatory requirements also shape fuel data needs, and understanding california truck emissions compliance requirements ensures your tracking system captures what CARB audits will look for.
For fleets running steep grades in Southern California, terrain adds a real variable, and the runaway truck ramp southern california infrastructure exists because grade operations are operationally distinct and fuel consumption on Cajon Pass runs will benchmark differently than flatland routes.
Mechanical reliability ties directly into fuel performance, and a truck that throws a semi truck radiator replacement cost situation mid-route is also a truck that has been running hot, which degrades injector performance and pulls MPG down before the failure event. Maintenance and fuel efficiency are not separate budgets. They are the same number from different angles.
According to the NACFE research on advanced fuel efficiency, the gap between best-practice fleets and average fleets on fuel efficiency is measurable and closeable with systematic data practices and targeted maintenance investment.
The Expert Market fleet management statistics report offers additional benchmarking data for U.S. fleets across operational cost categories, useful for validating your own numbers against industry norms.
Stop Losing Fuel Dollars Across Your Southern California Fleet
Every day your trucks run without a fuel tracking system in place, you are funding inefficiency you cannot see. Precision Diesel serves fleets across Los Angeles County, Orange County, Riverside County, and surrounding areas with mobile diesel maintenance that keeps your trucks running at their mechanical best, which is the foundation of any fuel reduction strategy. Call Precision Diesel at (714) 878-2571 and ask about mobile fleet maintenance scheduling for your operation.
Frequently Asked Questions
What is fleet fuel management?
Fleet fuel management is the systematic process of tracking every gallon of fuel purchased, consumed, and potentially lost across an entire fleet of vehicles.
It connects fuel transactions to specific trucks, drivers, odometer readings, and dates so that managers can calculate real consumption rates, spot anomalies, and identify where fuel spend is leaking. The goal is not just accounting. It is operational control over your single largest variable cost, which ATRI’s 2026 data puts at 20 to 30% of total carrier operating expenses.
How do you calculate truck MPG?
Use the full-tank method: fill the tank completely, record the exact odometer reading, drive, then fill completely again and divide miles traveled by gallons added on the second fill.
Partial fills break this calculation. If a driver tops off mid-trip without logging it, the next full-tank reading will appear artificially efficient because the gallons-added figure is incomplete. Require drivers to record the exact odometer at every fill, not a rounded estimate. Over 90 days of clean data, you will have a reliable MPG baseline for each truck that you can trend over time and use to flag mechanical degradation before it becomes a breakdown.
How much fuel does a truck burn while idling?
The U.S. Department of Energy estimates a diesel engine burns approximately 0.8 gallons per hour at idle.
That rate sounds manageable until you multiply it across a fleet with daily idling habits. A single truck idling two hours per day burns roughly 580 gallons per year, which costs approximately $2,320 at $4.00 per gallon. On a 20-truck fleet, that is more than $46,000 annually in fuel that moves no freight and generates no revenue. Automatic engine shutoff policies, auxiliary power units (APUs), and telematics-based idle alerts are the three most common tools fleets use to address this. The trade-off with APUs is upfront cost, typically $8,000 to $12,000 per unit installed, but the payback period on a high-idling truck can be under two years.
How do you track fuel in a spreadsheet?
A basic fuel tracking spreadsheet needs six columns: truck unit number, date, odometer reading, gallons purchased, fuel cost, and fill location.
From those six fields, you can calculate MPG per fill interval (odometer delta divided by gallons), cost per mile, and cumulative spend by truck or by month. The limitation of spreadsheets is data entry discipline. Every missed field or rounded odometer reading corrupts the trend line. Spreadsheets work for fleets of five trucks or fewer where a single person controls data entry.
Beyond that size, the manual process creates gaps that hide the theft and idling losses that a fuel card system or telematics platform would catch automatically. If you are using a spreadsheet, build a data validation rule that flags any MPG value more than 15% above or below that truck’s rolling average. That single check catches most anomalies worth investigating.
What is the difference between fuel management and expense reporting?
Expense reporting records what was spent. Fuel management explains why consumption happened and where it can be reduced.
An expense report tells you that Truck 14 cost $4,200 in fuel last month. Fleet fuel management tells you that Truck 14’s MPG dropped from 6.8 to 5.9 starting three weeks ago, that the drop correlates with a new driver assignment, and that two fill-up transactions occurred at a location 55 miles off the truck’s dispatched route. Expense reporting is a finance function. Fuel management is an operational function. The two overlap at the transaction record, but their outputs serve entirely different decisions. Fleets that treat them as the same thing tend to catch theft and mechanical degradation months later than fleets that run a dedicated fuel management process.
The Bottom Line on Fleet Fuel Management
Fuel is not a cost you accept. It is a cost you measure, track, and systematically reduce through better data, better maintenance, and better driver accountability. The fleets pulling the furthest ahead are not running newer trucks across the board. They are running tighter data practices on the trucks they already have, connecting fill-up records to GPS data, maintenance logs, and driver assignments to find the losses that show up as averages on expense reports but never get addressed.
For Southern California fleets operating across the grades, congestion, and compliance requirements of LA, Orange, and Riverside counties, the mechanical side of fuel efficiency is non-negotiable. A truck with a failing cooling system, dirty DPF, or degraded injectors will underperform its fuel baseline every single week. Precision Diesel’s mobile mechanics come to your yard or your truck’s location, so deferred maintenance stops being a scheduling problem. Call (714) 878-2571 to schedule a fleet maintenance visit and start closing the gap between what your trucks should burn and what they actually do.
Research Sources
The data and claims in this article were drawn from the following sources, verified 2026.
